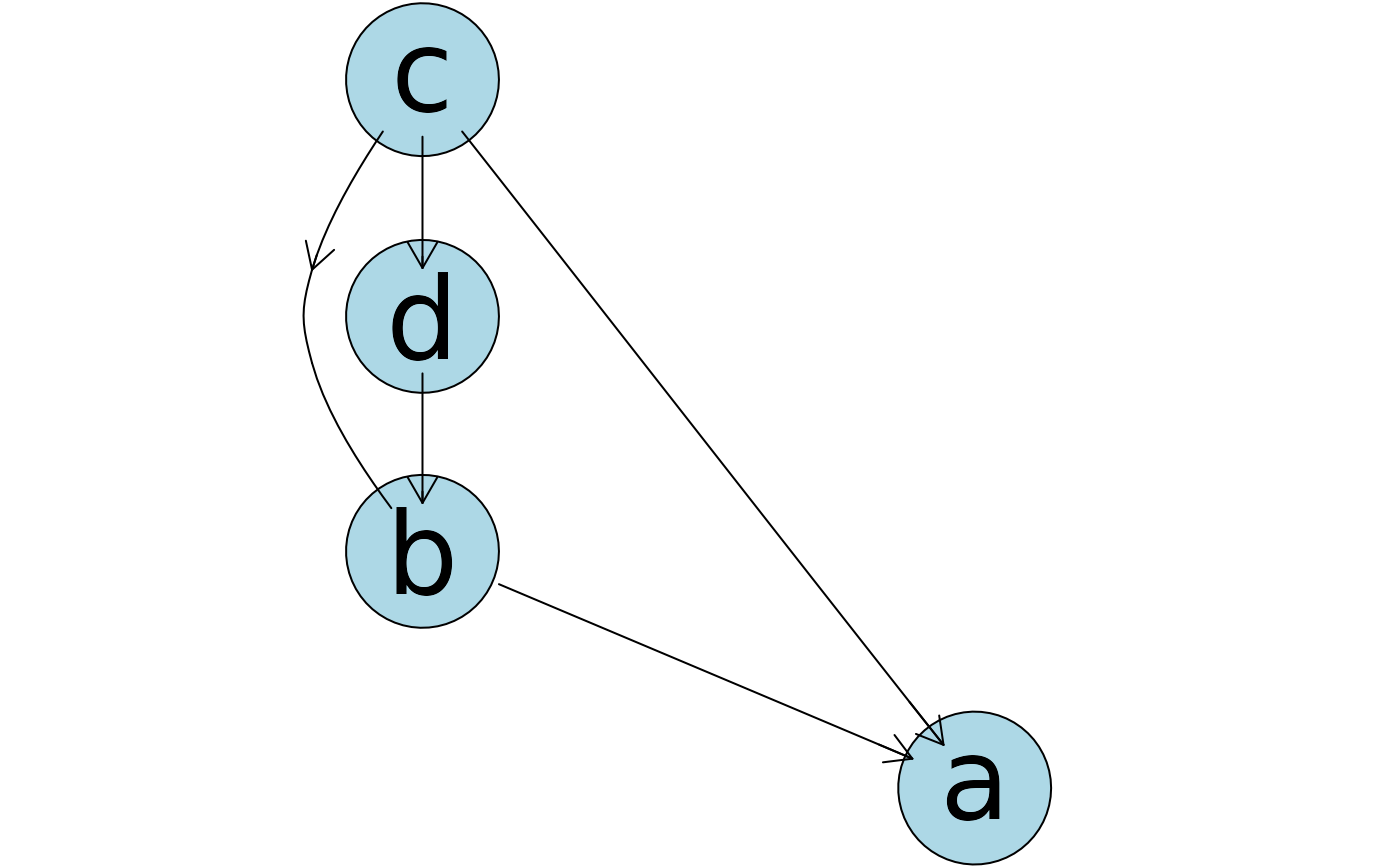
This function returns standard metrics for DAG description. A list that contains the number of nodes, the number of arcs, the average Markov blanket size, the neighborhood average set size, the parent average set size and children average set size.
Value
A named list that contains following entries: the number of nodes, the number of arcs, the average Markov blanket size, the neighborhood average set size, the parent average set size and children average set size.
Details
This function returns a named list with the following entries: the number of nodes, the number of arcs, the average Markov blanket size, the neighborhood average set size, the parent average set size, and the children's average set size.
The dag can be provided using a formula statement (similar to glm).
A typical formula is ~ node1|parent1:parent2 + node2:node3|parent3.
The formula statement have to start with ~.
In this example, node1 has two parents (parent1 and parent2).
node2 and node3 have the same parent3.
The parents names have to exactly match those given in node.names.
: is the separator between either children or parents,
| separates children (left side) and parents (right side),
+ separates terms, . replaces all the variables in node.names.
References
West, D. B. (2001). Introduction to graph theory. Vol. 2. Upper Saddle River: Prentice Hall.
Examples
## Creating a dag:
dag <- matrix(c(0,0,0,0, 1,0,0,0, 1,1,0,1, 0,1,0,0), nrow = 4, ncol = 4)
dist <- list(a="gaussian", b="gaussian", c="gaussian", d="gaussian")
colnames(dag) <- rownames(dag) <- names(dist)

infoDag(dag)
#> $n.nodes
#> [1] 4
#>
#> $n.arcs
#> [1] 5
#>
#> $mb.average
#> [1] 3
#>
#> $nh.average
#> [1] 2.5
#>
#> $parent.average
#> [1] 1.25
#>
#> $children.average
#> [1] 1.25
#>
plot(createAbnDag(dag = dag, data.dists = dist))

