Provided with node names, returns an abnDAG.
Arc density refers to the chance of a node being connected to the node before it.
Arguments
- node.name
a vector of character giving the names of the nodes. It gives the size of the simulated DAG.
- data.dists
named list corresponding to the
node.namespecifying the distribution for each node. If not provided arbitrary distributions are assigned to the nodes.- edge.density
number in
[0,1]specifying the edge probability in the dag.- verbose
print more information on the run.
Value
object of class abnDag consisting of a named matrix, a named list giving the distribution for each node and an empty element for the data.
Details
This function generates DAGs by sampling triangular matrices and reorder columns and rows randomly.
The network density (edge.density) is used column-wise as binomial sampling probability.
Then the matrix is named using the user-provided names.
Examples
simdag <- simulateDag(node.name = c("a", "b", "c", "d"),
                      edge.density = 0.5,
                      data.dists = list(a = "gaussian",
                                        b = "binomial",
                                        c = "poisson",
                                        d = "multinomial"))

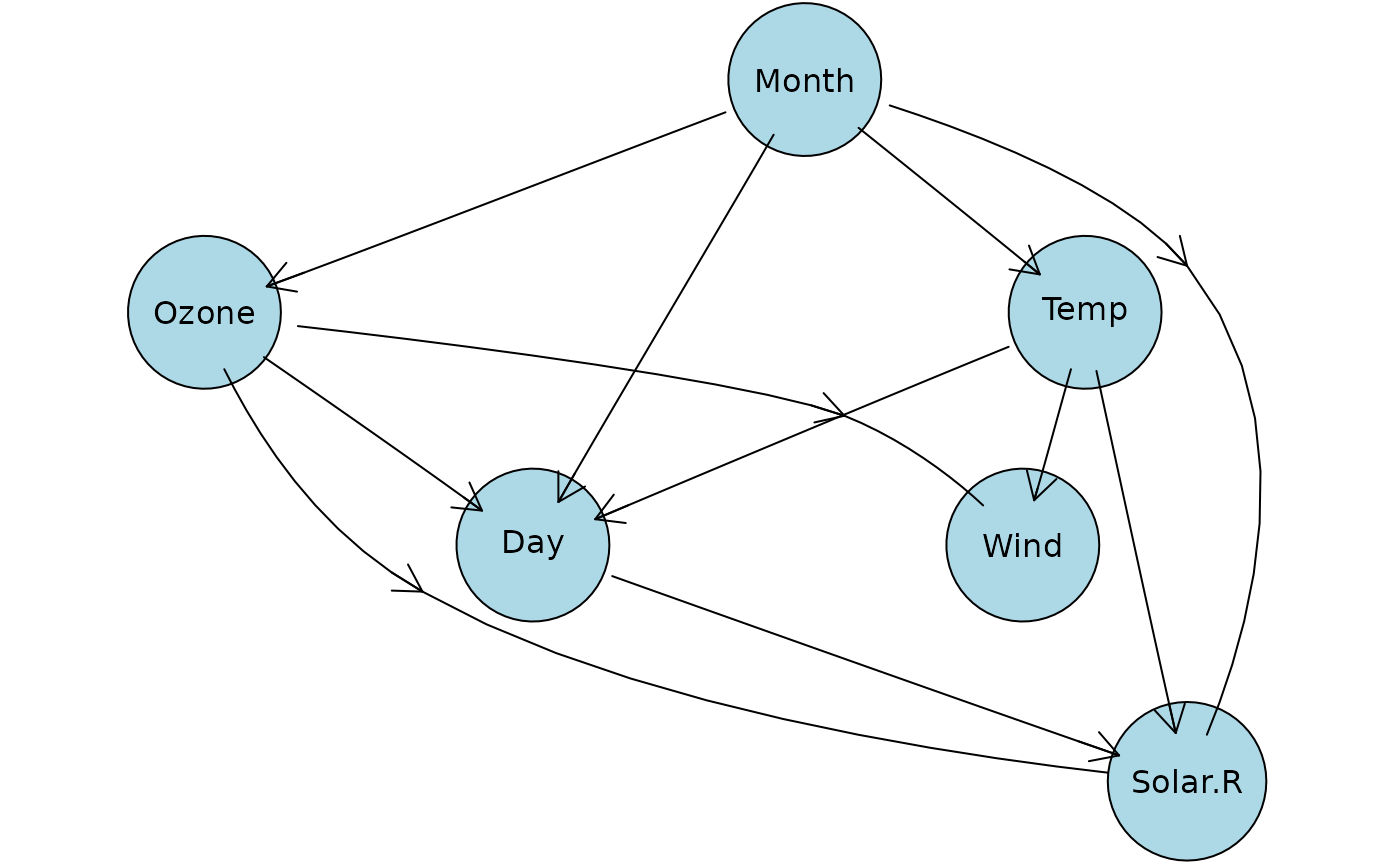
## Example using Ozon entries:
dist <- list(Ozone="gaussian",   Solar.R="gaussian",  Wind="gaussian",
             Temp="gaussian",    Month="gaussian",    Day="gaussian")
out <- simulateDag(node.name = names(dist), data.dists = dist, edge.density = 0.8)
plot(out)

